Custom Data
Introduction
XLT captures a lot of data out of the box, and since it’s using open data formats (xml/csv) it is well fitted for custom analytics and reporting. In addition to the recorded information about transactions, actions, and requests being executed as well as event information you can also get
- custom events,
- custom timers,
- custom values and
- external data.
This page shows you how to add the different kinds of custom information to your test scenarios. To learn more about the format and contents of the recorded csv data and the meaning of every column depending on the data record type, see Result Data.
Custom Events
Custom events are your tool to count how often certain things were happening during a load test. They can be used to record noticeable events that aren’t really errors.
Event parameters are the event name and the detail message. All recorded events are grouped by test scenario, and the total number of occurences per scenario as well as the number of occurences for each message will be counted.
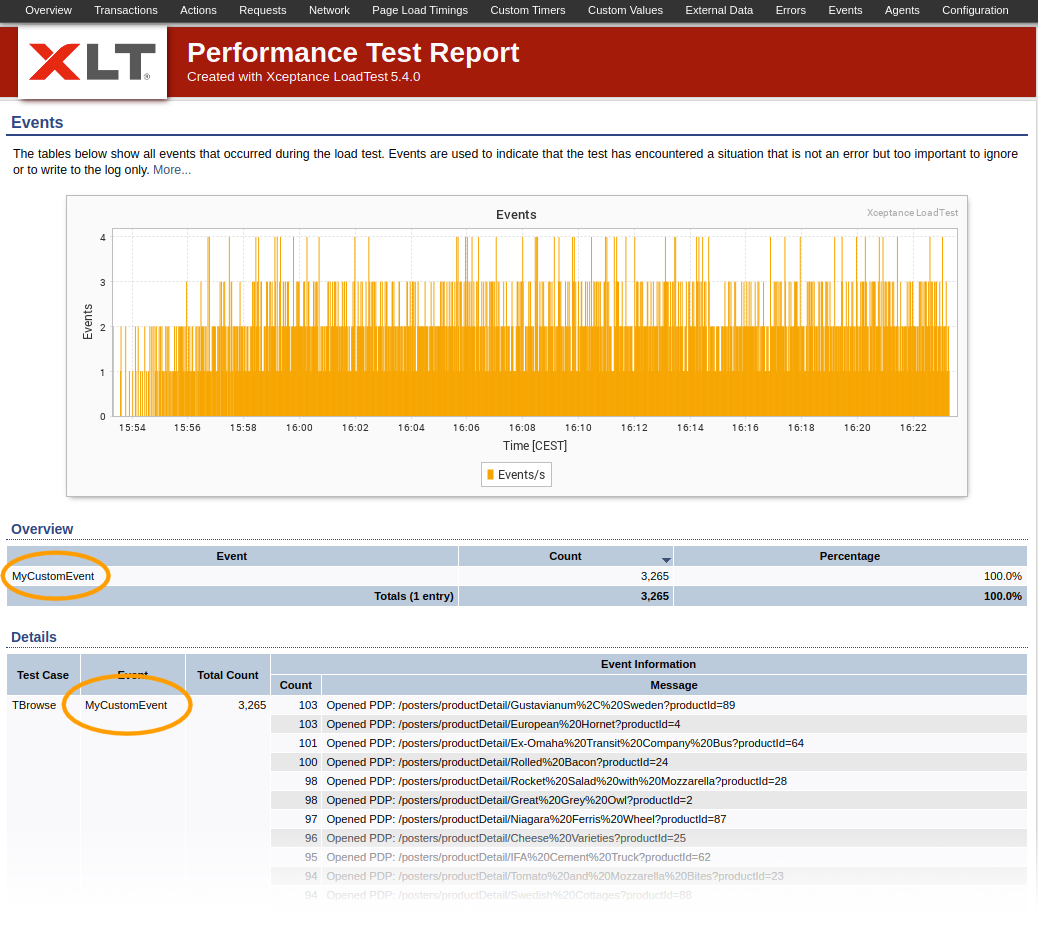
Custom Events in the Test Report
To log a custom event, you need to add this to your test code:
EventData data = new EventData("ProductHasNoPrice"); // sets timestamp
data.setTestCaseName("TOrder");
data.setMessage("PID: 12345");
Session.getCurrent().getDataManager().logDataRecord(data);

// or even shorter:
Session.logEvent("ProductHasNoPrice", "PID: 12345");
The resulting entry in timers.csv looks like this:
E,ProductHasNoPrice,1456928543182,TOrder,PID: 12345
Custom Timers
Custom timers are used to record measurements of elapsed time in your test scenarios. The logged data contains the runtime in ms as well as a failed flag for the measured action. The recorded data will be shown in the Custom Timers section in the load test report. This rendering will show the same level of detail as other timers in the report.
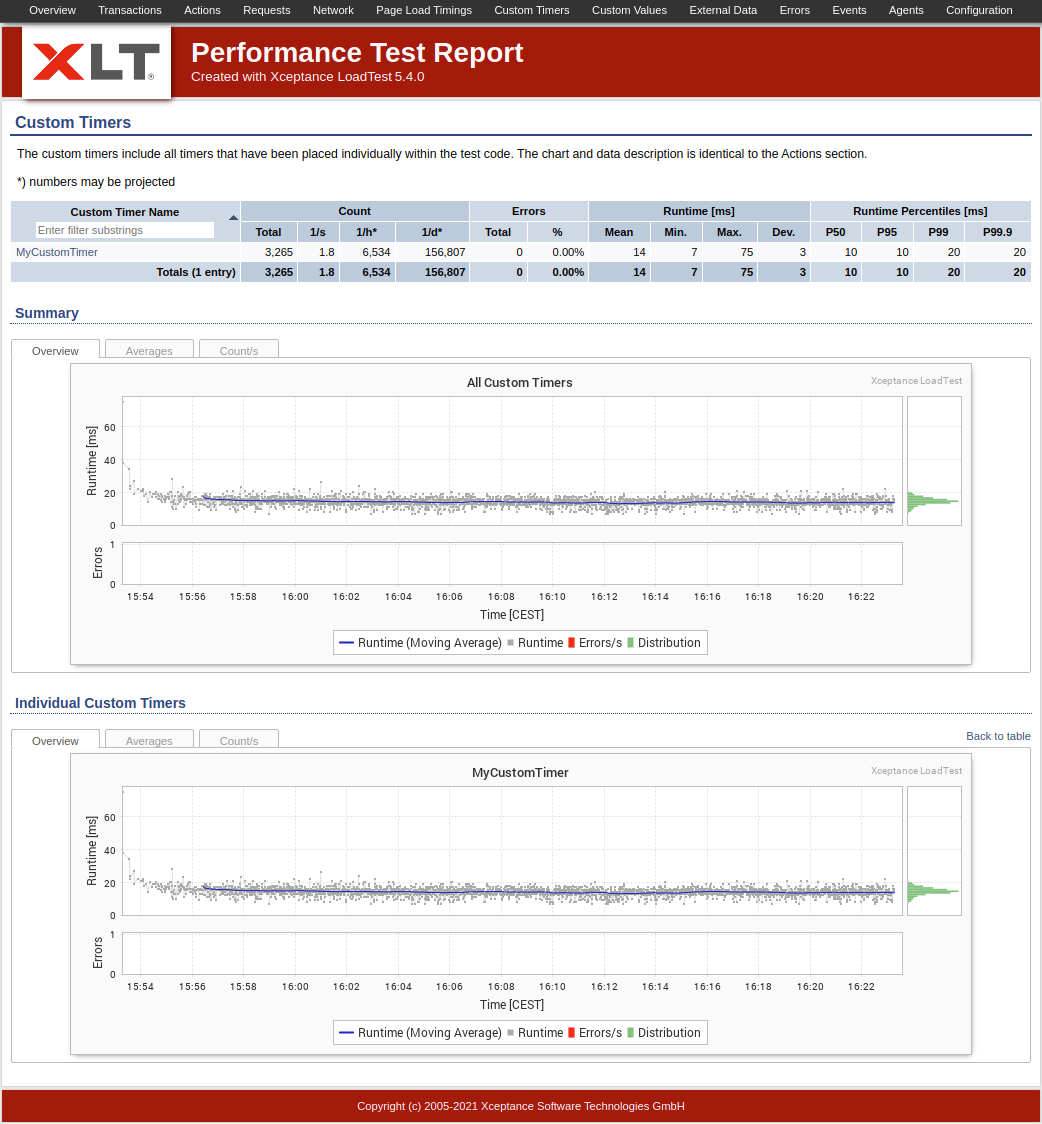
Custom Timers in the Test Report
To add custom timers to your test scenario, please adjust your code similar to this example:
CustomData data = new CustomData("Foo"); // sets start time

try
{
// do the things you want to measure
}
catch (Throwable t)
{
    data.setFailed(true); // mark the action as failed
    throw t;
}
finally
{
    data.setRunTime(); // automatically sets elapsed time as runtime
    Session.getCurrent().getDataManager().logDataRecord(data);
}
The resulting entry in timers.csv looks like this:
C,Foo,1456928543182,1234,true
Custom Values
Custom values are used to record measurements of arbitrary double values. They will show up in the Custom Values section in the load test report with almost the same level of detail as timers.
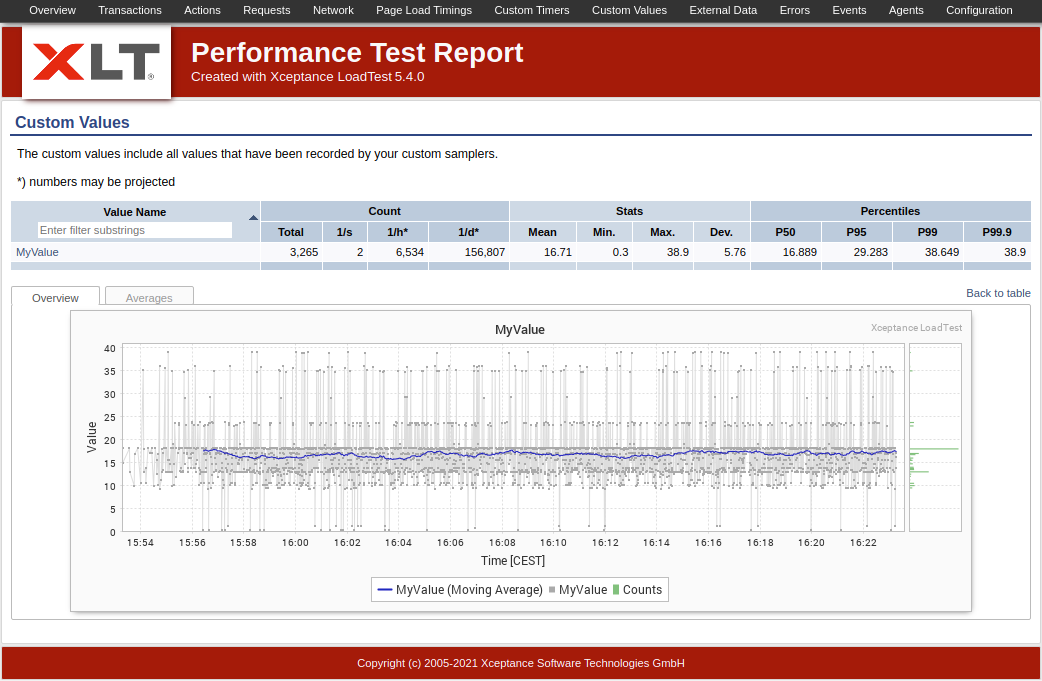
Custom Values in the Test Report
Recording custom values during your test scenario looks like this:
double value = 0.1234; // determine the value

CustomValue data = new CustomValue("CacheHitRatio"); // also sets timestamp
data.setvalue(value);

Session.getCurrent().getDataManager().logDataRecord(data);
The resulting entry in timers.csv looks like this:
V,CacheHitRatio,1456928543182,0.1234
Custom Samplers
Custom samplers make use of custom values to regularly record measurements during a load test. Custom samplers are typically used for values that are not related to a specific test scenario.
To this end, provide a custom sampler class extending com.xceptance.xlt.api.engine.AbstractCustomSampler. The sampler gets configured in the test suite configuration files (recommended location is project.properties).
The sampler must override the execute() method that is called after each interval time (see configuration). Furthermore, the sampler might override the methods initialize() or shutdown() getting called just once for the sampler (before the first call of execute() or on shutdown).
The logged custom value is the return value of the execute() method.
The AbstractCustomSampler can store any double value. The stored value indicates the absolute value at a certain point in time. The corresponding report chart directly shows the logged value.
Example Implementation
Here’s a small example implementation of a custom sampler that records random values:
public class ValueSamplerDemo extends AbstractCustomSampler
{
    public ValueSamplerDemo()
    {
        super();
    }


    @Override
    public void initialize()
    {
        // initialize
    }


    @Override
    public double execute()
    {
        // generate random value based on the configured limits

        // get properties
        final String lowerLimitProp = getProperties().
                    getProperty("generatedValueLowerLimit");
        final String upperLimitProp = getProperties().
                    getProperty("generatedValueUpperLimit");

        // convert to integer
        try
        {
            final int lowerLimit = Integer.valueOf(lowerLimitProp);
            final int upperLimit = Integer.valueOf(upperLimitProp);

            // return the value to be logged
            return
                XltRandom.nextInt(lowerLimit, upperLimit) +
                XltRandom.nextDouble();
        }
        catch (final NumberFormatException e)
        {
            // log 0 in case of an exception
            return 0;
        }
    }

    @Override
    public void shutdown()
    {
        // clean up
    }
}
Example Configuration
To register and configure your sampler, provide these properties:
com.xceptance.xlt.customSamplers.1.class = com.xceptance.posters.loadtest.samplers.ValueSamplerDemo
com.xceptance.xlt.customSamplers.1.name = DemoValueSampler
com.xceptance.xlt.customSamplers.1.interval = 1000
com.xceptance.xlt.customSamplers.1.chart.title = Demo Value Sampler
com.xceptance.xlt.customSamplers.1.chart.yAxisTitle = Value
com.xceptance.xlt.customSamplers.1.property.generatedValueLowerLimit = 50
com.xceptance.xlt.customSamplers.1.property.generatedValueUpperLimit = 60
...
The properties have the following meaning:
com.xceptance.xlt.customSamplers.n.is the saved key for custom sampler properties. Each sampler configuration block must have a unique number (callednin this example). The numbers don’t need to be in strictly successive order.classpoints to the sampler class (including full package path).nameis a customizable name of the sampler.intervaldefines the period the sampler is started at (in milliseconds, or as a time period, e.g.1m 30sor90s). The value must be positive (including 0). A new sampler will be started only if it is executed for the first time or if the previous sampler has come to an end.- Providing a
chart.titleis optional. By default, the sampler name is used.chart.yAxisTitledefines the title of the y-axis for the rendered chart. - Providing further sampler
propertiesis optional. The properties can be accessed by calling the methodsgetProperties()orgetProperty(key)(where key is the string in the configuration betweencom.xceptance.xlt.customSamplers.n.property. and the equals sign (=). In the present example, the keys aregeneratedValueLowerLimitandgeneratedValueUpperLimitwhich are used for the random number generation). Sampler property keys must not contain dots or whitespace. Apart from that they are free in name and count.
Result
XLT will then take care to execute your sampler regularly. It will show up in the Custom Values section of the load test report just like other custom values.

Custom Samplers in the Test Report
External Data
Sometimes client side measurements are not enough - that’s why XLT is able to enrich its reports with statistics and charts from externally gathered data. Use this approach if it’s impossible to access the external data source directly during load testing time, but you would like to see that data as part of the test report, as this simplifies analyzing the system behavior.
Some examples for usage of external data are
- resource usage data (CPU, memory, disk space, network usage),
- cache sizes,
- GC overhead, …
To make use of external data, it needs to be collected during the load test, using any appropriate tool. After the load test you gather any relevant data from other systems and make it available as data files in the same results folder as your regular load test result data. When generating the load test report, the report generator processes these additional data files and makes that data available in the load test report as data tables or charts on the External Data page.
Types of Data
XLT supports two different types of external data.
Sampled data is data that was recorded periodically and that changes over time. Each sampled value must be accompanied by a timestamp. This type of data can be displayed as a graph, and from all the values some basic statistics (mean, minimum, maximum) can be calculated and shown in the report.
- Example: A data file with a timestamp/CPU usage value pair per line.
Precomputed data is data that results from an external value processing and aggregation task. This data is not timestamped, as there is only one aggregated value per data item. Any further data processing does not make sense, so that data will simply be rendered as a table. Consequently, such data can neither be graphed, nor will any statistics be calculated.
- Example: A file that contains the total number of requests per application tier with a tier/requests pair per line.
The external data files can use csv format (which works out of the box) or other formats (which can be read using custom parsers).
Data Parsers and Value Sets
To read and interpret external data files, a Parser class is needed for each type of file or format. The parser takes a line of input (with possibly multiple values) and parses it to a generic set of values. Typically, one line contains all data items of a value set. Sometimes, however, the values are spread across multiple lines. Certain tools, iostat for instance, produce such types of data files. In this case, the parser has to process multiple lines of input before a value set is complete.
Typically, a data file contains many value sets. The parsed value sets for a certain file must have a uniform structure, i.e. they should all contain the same data items at the same position. Otherwise the report generator cannot process them correctly.
A value set can optionally carry a timestamp. This timestamp is valid for all the data items in the value set. Whether or not a timestamp will be set is defined by the parser. If the timestamp is present, the report generator will treat the value set as sampled data, otherwise as precomputed (“plain”) data. Note that if the timestamp does not lie within the load testing period, the value set will be ignored. This way you don’t have to cut out the interesting part from your, say, daily logs.
Later on, when configuring the data to show in the report, we need a way to select the values of interest in a value set. A certain value can always be accessed by an index (starting with 0). Alternatively, you may also use a name to address a data item. However, this requires the parser to store the item under that name. To this end, the parser could use a hard-coded name or it somehow retrieves the name to use right from the data file. For instance, a CSV file could provide a header line with all the value names.
Predefined Parsers
XLT ships with a set of predefined parsers for CSV data files. In case you want to process CSV files with sampled data, use one of the following parsers:
- SimpleCsvParser: Extracts the data by splitting each line into a set of values and uses the column index as the value name.
- HeadedCsvParser: Like SimpleCsvParser, but takes the value names from the first line of the file.
Note that these two parsers require the timestamp to be in the first column of the CSV data file.
If the external CSV data is precomputed and just needs to be displayed as a data table, use the PlainDataTableCsvParser class.
Custom Parsers
If you need to use other input file formats than CSV, you have to write your own custom parser class. Your class must extend com.xceptance.xlt.api.report.external.AbstractLineParser.
For an example of an advanced parser class that deals with sampled data, see the two parser implementations in the source directory of the demo project. They process the logs of the command line tool iostat.
- IostatCpuParser: Parses the CPU section of an iostat log.
- IostatDeviceParser: Parses the Device section of an iostat log.
Note that if you need to write your own custom parsers, you will have to make the compiled parser classes available in the class path of XLT before the report generator can use them. The simplest way to do this is to deploy the classes packaged as a JAR file to <xlt>/lib.
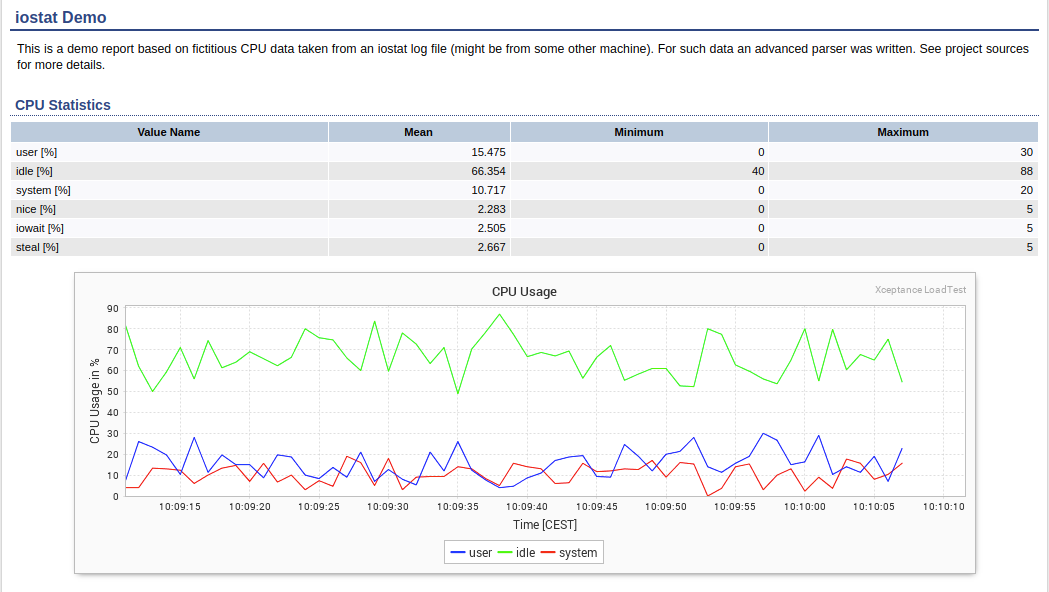
Data parsed with a custom parser in the External Data section of the Test Report
Configuration
Since external data is completely custom, there is also no standard or built-in way how to interpret and display this data. That’s why you need to help the report generator by providing a detailed configuration of how to parse the data, choosing the values of interest, and how to display them in the report.
All this is configured in externaldataconfig.xml. This file is expected in the config subdirectory of your load test suite, where all the other load test configuration files live. If XLT can’t locate it there, it will try to find it in its configuration directory <xlt>/config.
General structure of the configuration file
<files>
<file source="embedded_00/CustomData/data.csv" encoding="UTF-8" parserClass="com.xceptance.xlt.api.report.external.SimpleCsvParser">

    <headline>Demo CSV report</headline>
    <description>This is a demo report based on data from a CSV file.</description>

    <properties>
        <property key="parser.dateFormat.pattern" value="dd.MM.yyyy HH:mm:ss" />
        <property key="parser.dateFormat.timeZone" value="GMT+0" />
        <property key="parser.csv.separator" value="," />
    </properties>

    <tables>...</tables>

    <charts>...</charts>

</file>
</files>
As you can see, the configuration is centered around the various data files you want to be parsed, processed, and rendered. There can be one ore more input files. The data of each file will be presented in an own subsection in the load test report. For each file/subsection you can define a headline and a description, configure charts (each with one or more data series) or data tables (each with a different row or column definition) and additional properties to use when parsing the file or rendering the data.
The basic data fields are used as follows:
file: Defines what file is to be processed and in which way.source: The path to the data file. If the path is relative, it will be resolved against the root directory of the current result set. [required]parserClass: The full class name of the parser class to use for parsing the data file. [required]encoding: The character encoding to use when reading the data file. [optional, defaults to “UTF-8”]
headline/description: Simply provide the text to show as the section header and section description.
Properties define additional configuration options. Currently, these are parser settings only, which are used as follows:
property: additional configuration option, consisting ofkey: The property name. [required]value: The property value. [required]
The following property names are predefined by XLT, but note that your custom parser classes may define additional properties:
parser.dateFormat.pattern: The date/time pattern to parse a time value. SeeSimpleDateFormatfor more information on date/time patterns. [optional; the time value is expected to be a Java timestamp]parser.dateFormat.timeZone: The time zone to use when interpreting time values. [optional, defaults to GMT/UTC]parser.csv.separator: The field separator character for CSV files. [optional, defaults to comma]
For tab-separated CSV files, use 	 as the value of parser.csv.separator.
How to configure the data tables
<tables>
<table title="CPU Statistics" type="minmaxavg">
    <rows>
        <row valueName="1" title="CPU Temperature" unit="°C" />
        <row valueName="2" title="CPU Usage" unit="%" />
    </rows>
</table>
<table title="Network Statistics" type="minmaxavg">
    <rows>
        <row valueName="3" title="Inbound Network Traffic" unit="KB/s" />
        <row valueName="4" title="Outbound Network Traffic" unit="KB/s" />
    </rows>
</table>
</tables>
tabledefines the properties of a data table. Each table is defined with its own row or column definition.title: the title of the table [required]type: the type of the table, eitherminmaxavgorplain. Useminmaxavgfor sampled data only, in which case the table will show the mean, the minimum, and the maximum of the sampled values. Similarly, useplainfor precomputed data only. [optional, defaults tominmaxavg]
row/col: Defines the layout of a data table. Tables can be laid out either row-wise or column-wise. If you use rows, the selected values will be shown each in a new table row, otherwise in a new table column. Choose the method that better fits your needs. Both elements provide the same set of configuration options:valueName: the name/index of the value to show [required]title: the title of the series [optional, defaults to the value name]unit: the unit of measurement [optional, defaults to none]

Data Tables in the External Data section of the Test Report
How to configure the charts
<charts>
<chart title="QuadCore CPU" yAxisTitle="CPU Temperature [°C]" yAxisTitle2="CPU Usage [%]">
    <seriesCollection>
        <series valueName="1" title="CPU Temperature" axis="1" color="#00FF00" average="10" averageColor="#008400" />
        <series valueName="2" title="CPU Usage" axis="2" color="#FF0000" average="10" averageColor="#840000" />
    </seriesCollection>
</chart>
<chart title="Network Traffic" yAxisTitle="Throughput [KB/s]">
    <seriesCollection>
        <series valueName="3" title="Inbound Network Traffic" color="#00FF00" average="10" averageColor="#008400" />
        <series valueName="4" title="Outbound Network Traffic" color="#0000FF" average="10" averageColor="#000084" />
    </seriesCollection>
</chart>
</charts>
-
chartdefines the chart title and the axes titles:title: the title of the chart [required, unique]xAxisTitle: the title of the x-axis [optional, defaults to “Time”]yAxisTitle: the title of the first/left y-axis [optional, defaults to “Values”]yAxisTitle2: the title of the second/right y-axis [optional, defaults to empty in which case the axis is not shown]
-
Each chart contains a collection of series (
seriescollection). Aseriesdefines which value will be shown as a graph in the chart and how the graph will be styled:valueName: the name/index of the value to graphtitle: the title of the series [optional, defaults to value name]color: the color of the graph [optional, by default a color from a predefined color set is chosen]axis: the axis to use for this series, either “1” for the first/left axis or “2” for the second/right axis [optional, defaults to “1”]average: the percentage of values to use to calculate the moving average [optional, defaults to empty, in which case no moving average graph will be shown]averageColor: the color to use for the automatically added moving average graph [optional, by default a color from a predefined color set is chosen]
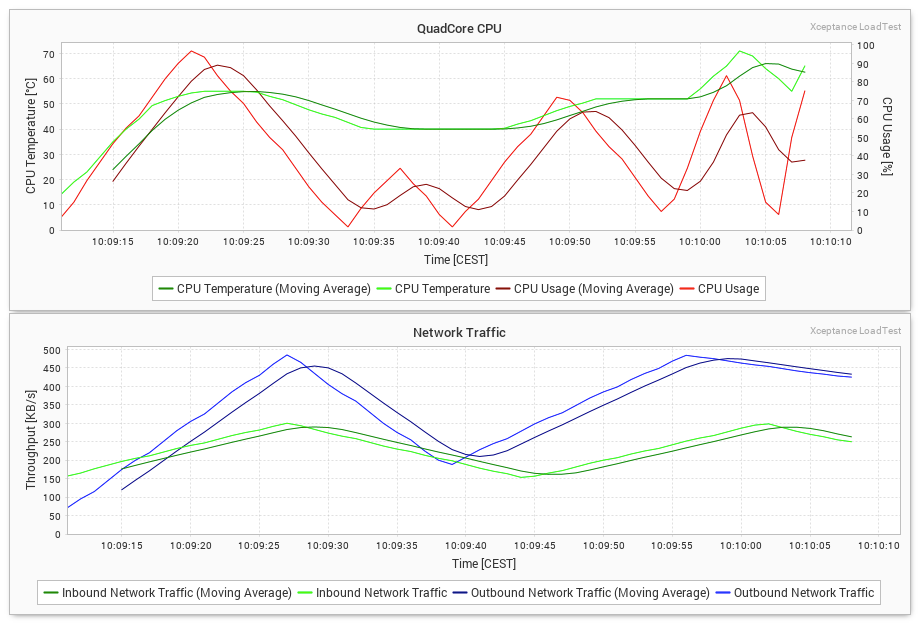
Charts in the External Data section of the Test Report
Example
XLT ships with a demo project for external data. This project does not only contain a load test result set enriched with external data files and the corresponding load test report, but also shows how to implement custom data file parsers and how to configure the report generator to produce the report. The demo project for external data is located in <xlt>/samples/demo-external-data.