About
Monitoring Basics
XTC can be used to monitor your applications. By regularly running test cases, XTC will provide you an overview of the performance and availability of your application over time, providing lots of data and possibly valuable insights.
XTC offers a lot of features to make monitoring easier for you, however as it is still growing this page can just give you a first glimpse on what is possible.
Monitoring Features - A Rough Overview
Dashboard
On entering an XTC monitoring project, you will be presented the Dashboard, containing a first overview of your application’s performance: here you will find the overall status, the current status for each test scenario, and an overview of the latest scenario errors.

The overview on the dashboard of a monitoring project.
History
History provides more information about the latest scenario executions. Here you can define the time range to view (maximum: the time range shown in Configuration > Data Persistence > History) and select the type of tests to display in the top left (successful, warnings, errors, aborted and/or running tests).

The history view of a monitoring project.
By clicking the names of the scenarios, a detail view will open, containing different options and information depending on whether the scenario is running, was successful, was aborted, or returned errors or warnings.

Detail view of a scenario that finished with errors. You will get the complete stack trace here.

Detail view of a successful scenario run with more information. You can view the execution log and download measurements (links top right).
Metrics
In addition to the data provided in History, in Metrics you will find a graphical dashboard for your monitoring project.
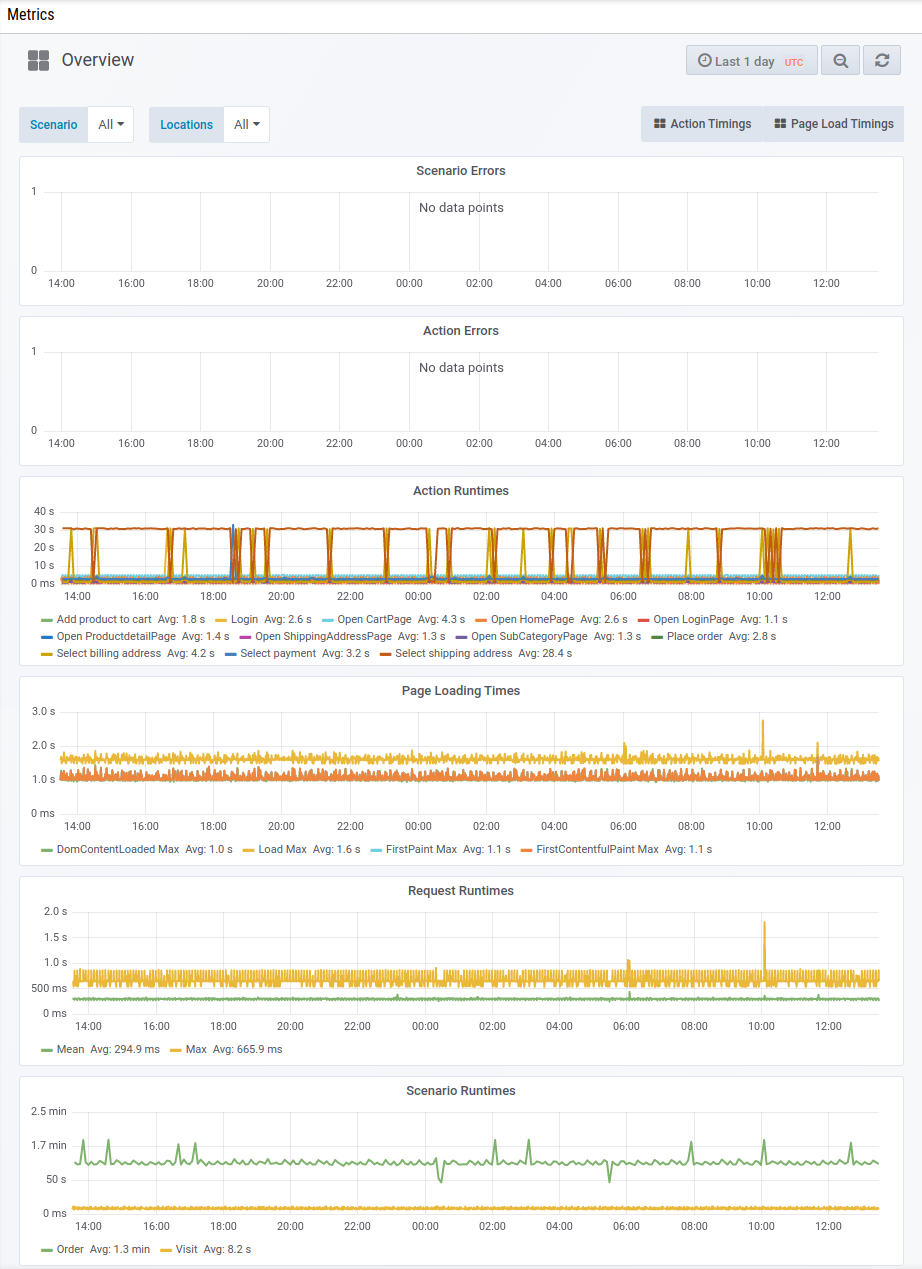
The Overview page of the metrics dashboard.
This dashboard visualizes the most interesting measurements over time so you can spot trends or periods of slowness more easily.
Currently you can not configure this dashboard. XTC offers a default dashboard for every monitoring project it runs.
Exports
Finally, XTC generates a compressed archive of test execution data (a csv file containing basic information for each executed scenario, such as start time, duration, scenario name, result, failure message or runtime values) automatically for every finished month of your monitoring project. You can find and download this data under Exports.