Test Evaluation
Generating a Test Report
When your load test has finished, you might want to render a report based on the gathered data and open it in the browser of your choice:
Command Line
$ ./create_report.sh ../results/20200202-123400
$ firefox ../reports/20200202-123400/index.html
Master Controller
When running the master controller in interactive mode, a load test report can be created for the last downloaded results right from inside the master controller. Simply choose cfrom the menu, and the report will be created as if the create_report script had been invoked manually. This is especially useful when downloading results in the middle of a load test to see how things are going.
To learn more about the different report types XLT can create, follow up here. For more information on how to customize your reports, please have a look at the Report Options.
Reading a Test Report
The Load and Performance Test Report gives you all the information needed for a detailed analysis of a load test run. It provides several sections, each consisting of at least one table and one or more charts that help to visualize the progress of measurements over time graphically. Let’s have a look at the top menu sections of each load test report:
Overview
This section shows some general information about the load test (e.g. start and end time, duration), the load profile and the test comment (if any was given). It also displays a performance summary and network statistic for HTTP/HTML-based load tests.
Load Setup
To check whether the load setup was correct, you can review these points on the overview section of your test report:
- Transactions: were the right scenarios executed?
- Does the measurement period match your configuration?
- Was the thinktime duration as long as you expected?
Concurrent User Chart
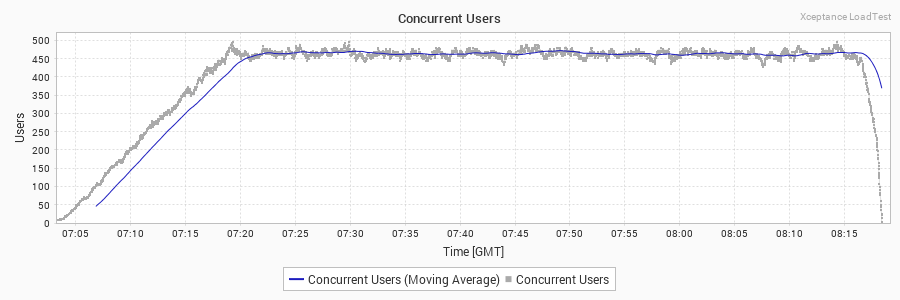
Also on your test report overview, in General Information, you will find the Concurrent Users chart right at the top.
- Is the ramp up visible?
- Are there any spikes up or down? How scattered are the data points(meaning does the arrival rate seem stable)?
Requests
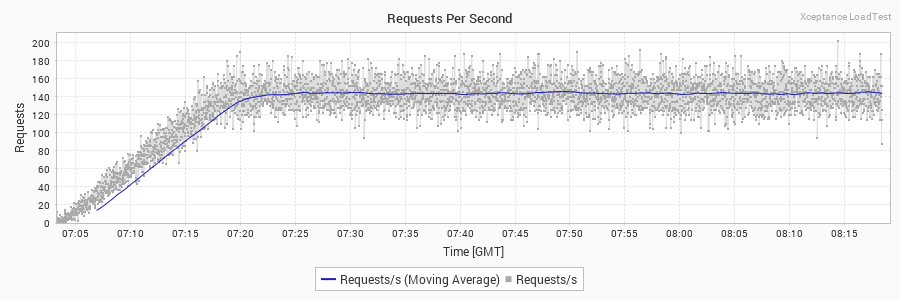
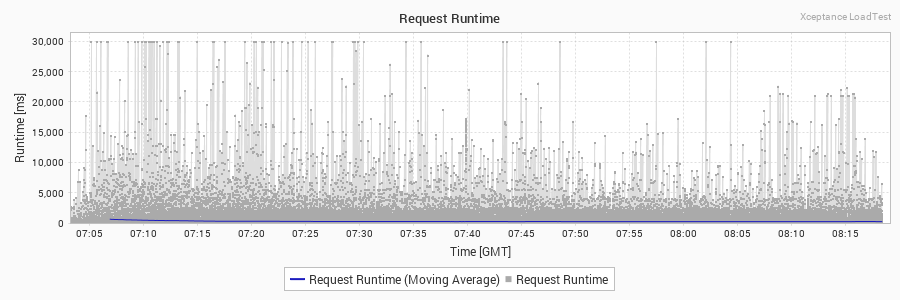
Right below the Concurrent Users chart you’ll find the Requests Per Second and Request Runtime charts.
- In the Requests Per Second, are there any spikes? Is the ramp up visible?
- Are the runtimes of the requests and their rate over time in the ballpark?
- Are there runtime patterns, spikes or waves?
Errors
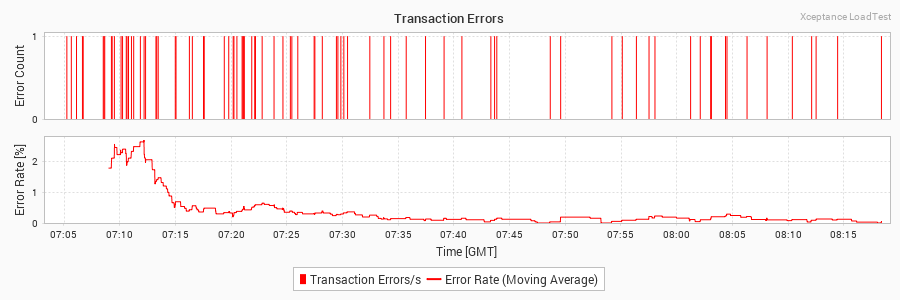
Further below is the Transaction Errors Chart.
- Do we have any errors?
- Do we have a pattern?
- Did we expect errors?
Misc
- Was the right timezone used for testing?
- Was PXX set correctly?
- Was SLA set correctly?
- Did the test run in the right time frame?
- Do the links to the results work?
- Was there any external data configured?
Transactions
Also in the top menu you’ll find the item Transactions. A transaction is a completed test case. A test case consists of one or more actions. The displayed transaction runtime includes the runtime of all actions within the test case, think times, and the processing time of the test code itself. If the test path of the test case is heavily randomized, the transaction runtimes might vary significantly. The average runtime shows the progress of the tests over time and is especially helpful for evaluating the outcome of long-running tests.
Actions
Test cases are made up of one or more actions. A single action consists of three steps: prevalidation, execution, and postvalidation. The data shown here indicates the time spent in the execution routine of an action. Therefore, its runtime includes the runtime of a request (e.g. an HTTP operation), and the time necessary to prepare, send, wait, and receive the data.
Requests
The request section is the most important statistics section when testing web applications. It directly reflects the loading time of pages or page components. Each row holds the data of one specific request. Its name is defined within the test case as timer name. The Count section of the table shows the total number of executions (Total), the calculated executions per seconds (1/s), minute (1/min), as well as projections or calculations of the executions per hour (1/h) and day (1/d). The Error section displays the total amount (Total) of errors that occurred throughout page or page component loading. The error count doesn’t include errors detected during the post-validation of the data received. Typical error situations are HTTP response codes such as 404 and 505, timeouts, or connection resets. The runtime section of the table shows the arithmetic mean, the minimum and maximum runtimes encountered as well as the standard deviation of all data within that series. The runtime segmentation sections depicts several runtime segments and the number of requests within the segment’s definition. If the runtime of the test case is shorter than the displayed time period, e.g. test runtime was 30 min and the time period is hour, the numbers will be a linear projection. That means they will show a possible outcome of a longer test run if load and application behavior remained the same.
Network Statistics
The load test report features extensive network statistics on the Requests page displaying data for bandwidth utilization and socket timing information.
The Bandwidth tab displays information about the used incoming and outgoing bandwidth per request. XLT makes its measurements on the socket level and therefore the real transferred data out and in of the application is measured. XLT does not analyze or modify that data when taking the measurements. Bytes Sent comprises of all data that is sent out of the application including overhead such as http(s) headers and SSL protocol data. Bytes Received includes all received data and the connected overhead. There is no measurement difference between sent and received data.
Network Timing reports all low level network timing data that have been measured on socket level. Each measurement point contains information about minimum and maximum times occurred as well as the mean of all gathered data.
- Connect Time: Time needed to establish a connection to the other system. Please note when using keep-alive semantics during testing, the connect time will mainly be 0 except for the first request of a transaction.
- Send Time: Time required to send the request to the other system. Depending on the payload and the network speed, this data is often zero or very small.
- Server Busy Time: This indicates the waiting time between sending the last bytes and receiving the first bytes.
- Receive Time: The time spent receiving data. Measured from the first bytes received till the last bytes received.
- Time to First Bytes: Total time from the connection start till the first bytes are received. Includes Connect, Send, and Server Busy Time.
- Time to Last Bytes: Total time from the connection start till the last bytes are received. This is the time needed to connect, send, and receive data. Often this time is called network runtime. The request runtime in comparison contains the network runtime and the application time needed to process header and protocol information and transfer the data from socket level to the application level.
Network
The network section covers the areas of incoming and outgoing traffic during the load test. Sent Bytes is an estimated number based on the data given to the network layer. Cookies, for instance, are not included. Received Bytes is an accurate number because it’s based on the data received and includes HTTP header information. Depending on the test runtime, the numbers per hour and per day might be estimations based on a linear projection of the available data. If the test run included web activities or other activities returning an HTTP response code, it can be found here as well. Furthermore, all hosts that participated in the test run are listed in a separate table along with the appropriate number of requests that hit this host. Last but not least, this section contains a table that breaks down the received content to their announced type.
Page Load Timings
The Page Load Timings section offers deeper insight into the page loading performance of real browsers. During a page load, a browser typically goes through different phases and reaches different states. This section outlines the time it took to reach a certain state. The timings listed here include primarily page load timings, but since the perceived page loading performance is often influenced by how fast something is displayed on the page, paint timings are listed here as well.
XltChromeDriver or XltFirefoxDriver to run the browser. These are special WebDriver implementations that install an extension into the browser which is able to gather all the timings and report them to XLT.
Custom Timers & Values
The custom timers includes all timers that have been placed individually within the test code. The chart and data description is identical to the request section. In case custom samplers have been run during the test, the collected data is shown in the Custom Values section.
External Data
All external data gathered by other tools during the test run is shown here according to the configuration. See Custom Data for details on how to include external data in the report.
Errors
This section consists of a table that contains all errors thrown by the test cases along with an overview of all error types.
The Overview section lists the error message and the count. It ignores the stack trace to sum up common problems without relating them to the test case. The Details section beneath lists the full stack trace next to the test case and the directory in which you can find the data dump for further analysis.
Events
Events are used to indicate that the test has encountered a special situation that is not an error but too important to ignore or simply to write to the log. This section consists of a single table that lists all events that occurred during the test run including their name, amount, detail message and the name of the test case that produced this event.
You can use the XLT API and create your own events to learn about certain conditions, such as an unavailable product that doesn’t cause the test to stop but that needs your attention. While a few out-of-stock products may be okay, too many of them could affect the test behavior.
Agents
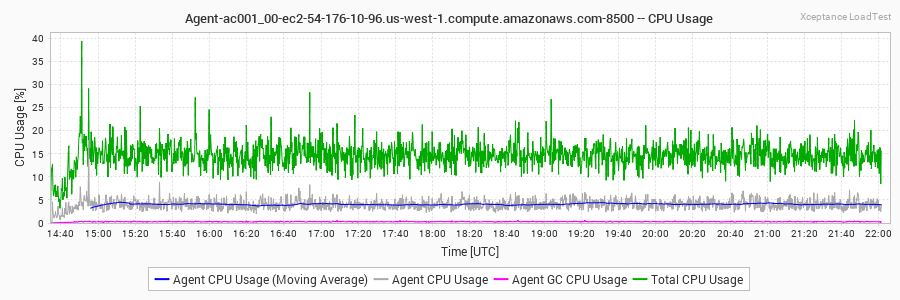
This section reports the resource utilization of each user agent in terms of CPU and memory usage. It helps to identify potential resource bottlenecks that might have influenced the load test. Note that all data is local to the JVM of the agent and therefore only covers a process view.
Look for the following (and check every agent that was used):
- Was the overall CPU usage per box <40%?
- Also check the agent CPU usage.
- Was the memory curve nice and steady, not hitting the max value?
Configuration
The configuration section lists the test configuration as well as the load profile used to run the test. It facilitates test reproduction and preserves the test settings for later test evaluation.
Filtering Data Tables and Charts
The request table can get rather long, and the list of charts below the table as well. So finding the information you are looking for may involve a lot of scrolling. But don’t despair - simply type a filter expression and the table will show only those rows whose names match the filter. Same for the charts. This works not only for requests, but also for transactions, actions, custom timers, and agents.
For advanced filter expressions, you can specify more than one filter substring in the filter input field, separated by a space. A table row (and its corresponding chart) remains visible only if the name matches all specified substrings (AND operation). Note that case does matter. When prefixing a substring with the ‘-’ character, the name must not contain the substring to remain visible. The filter syntax allows OR-ed filter expressions as well. Just use the ‘|’ character to start a new alternative.
Intermediate Results
If you started the master controller in interactive mode, you can download intermediate results during the test run and generate a report to see how the test is going. In automated environments, however, you would have to wait until the test run is finished before you can actually do so.
The master controller’s command line menu in interactive mode looks like this:
Xceptance LoadTest 5.2.0
Copyright (c) 2005-2020 Xceptance Software Technologies GmbH. All rights reserved.
XLT is Open Source and available under the Apache License 2.0.

(u) Upload test suite
(s) Start agents
(a) Abort agents
(r) Show agent status
(d) Download test results
(c) Create load test report
(q) Quit
=>
So to get an intermediate results and report, use the options (d) and (c) while the test is running. By default, the report will be created from the latest downloaded results and be named <timestamp>-intermediate. This can be useful to check the reasons for test failures while the test is still running.

