Result Browser
- Shows actions and requests of a transaction
- Includes all HTTP headers
- Shows real full unaltered response
- Displays approximate rendering
- Displays test settings
- Helps to find errors
- Is great for test documentation
Result Browser Properties
When running test cases, you can save the page output to disk. The relevant property is com.xceptance.xlt.output2disk. By default, it is set to never (always in development mode). If you want to enable page output to disk, copy the following lines to dev.properties or test.properties or set the already existing property accordingly:
## Enables page output to disk. Possible values are:
## - never ..... pages are never logged
## - onError ... pages are logged only if the transaction had errors
## - always .... pages are logged always
com.xceptance.xlt.output2disk = always
If you have saved the page output to disk and want links from the error entries in the load test report to the corresponding result browsers in the results directory in your report, make sure the property is set accordingly in reportgenerator.properties:
com.xceptance.xlt.reportgenerator.linkToResultBrowsers = true
By enabling page output to disk, a lot of data will be aggregated. To minimize this in load test mode, the property may be set to onError so that only the page output that resulted in an error is saved to disk. Since this single page on its own is not always enough to determine what generated the error, we can also set the number of actions previous to the error that should be kept as part of the record (this is set to 3 by default and to all in development mode):
#com.xceptance.xlt.output2disk.size = all
com.xceptance.xlt.output2disk.size = 3
Also, the dump mode (whether modified or only final pages are saved) may be defined:
#com.xceptance.xlt.output2disk.onError.dumpMode = modifiedAndFinalPages
com.xceptance.xlt.output2disk.onError.dumpMode = finalPagesOnly
So if an error occurs during a transaction in a load test, output2disk is set to onError and the size is set to 3, a result browser with the last 3 pages is written to disk. If the error condition is permanent (or present for a longer period of time), we might end up with thousands of (rather similar) result browsers. This tremendously increases the volume of data to be downloaded after the test, but does not provide any new information. That’s why you can limit the number of result browsers per type of error and agent.
How does the error limiter work?
When an error (exception) stops the test execution of a scenario, XLT will take the username (name of the test scenario such as TBrowse or TOrder) and a meaningful part of the stacktrace (message and some of the first lines) and calculate a hash. This hash forms the key to the storage map that counts if this error has been seen before.
For each type of error, XLT tracks the current number of stored result browsers and stops writing down any new result browser once the configured maximum number is reached. However, you may also configure a time period to periodically clear the counter.
In case we limit the number of errors, the error limiter logic works like that:
- If the error is not known, check if we still have room for this error (
maxDifferentErrors), if so, add it to the map and start to count the number of occurrences (ifmaxDumps> 0). - If the error is known, check whether we also want to limit the
maxDumpsper error, if so, dump it only if we still have room and increase the counter. - If the max dump limit is reached or the size limit for the map of hashes is reached, drop the dump request but still count the error normally (it won’t be suppressed from error charts and such).
- When an error is counted for the first time, a timer is started (for
resetInterval> 0). After the given interval, the hash is removed from the map and allows new errors to arrive and be counted.
If the resetInterval is 0, once the map with error hashes is full, it will never be cleared and hence the test stops to accept new error messages for dumping.
Important
Don’t put dynamic data into your stacktrace message such as unique product numbers, or timestamps. This will always create a new key to the counter and hence exhaust it quickly. In the worst case you don’t have a limiter in place, and you will run out of disk space quickly when you have a high error situation.
Settings
## Amount of different errors handled by the dump limiter.
## If not specified it is 0 and we allow an unlimited amount of different errors.
com.xceptance.xlt.output2disk.onError.limiter.maxDifferentErrors = 500

## Limit the number of dumped results per agent and error stack trace. This
## requires, that maxDifferentErrors is > 0. You can set it to -1 to dump
## all occurrences of an error (not recommended).
com.xceptance.xlt.output2disk.onError.limiter.maxDumps = 10

## Period before we remove the entry for a certain error from the tracking list
## to make room for new errors or, of course, the same again. This does not clear
## out the entire table. This is the time from the first occurrence of single problem.
##
## If the interval is 0 or not set the reset mechanism is turned off.
## The time period value can be specified in one of the following formats:
##   - total number of seconds
##     examples: '1234s' or '1234'
##   - natural style
##     examples: '0h 12m 0s', '0h 12m', '12m 0s' or '12m'
##   - digit style
##     examples: '1:23', '01:23', '0:1:23' or '0:01:23'
com.xceptance.xlt.output2disk.onError.limiter.resetInterval = 60m
Please note:
These settings are per running agent process! Hence, when you run ten machines with one agent each (the usual recommended default with JDK 11 and higher as well as G1 or Shenandoah as GC), you get about 500 (maxDifferentErrors) times 10 (agents) possible different errors. Assuming that each agent runs about the same test cases and (usually) encounters the similar error situations, it might not be far off under normal circumstances.
When saving request data to disk for the result browser, the request body of POST requests is currently limited to 8K by default and will be cropped when exceeding this value. If this is still too low for your most complex requests, for instance Web service requests with large JSON bodies, you can also tailor this limit to your needs (in bytes):
com.xceptance.xlt.output2disk.maxRequestBodySize = 12345
Using the Result Browser
The result browser contains the record of a test user session. It lists actions, request, and response details and supports error diagnosis.
The easiest way to open the result browser is by opening the link at the bottom of the console output after you ran a single test from your IDE:
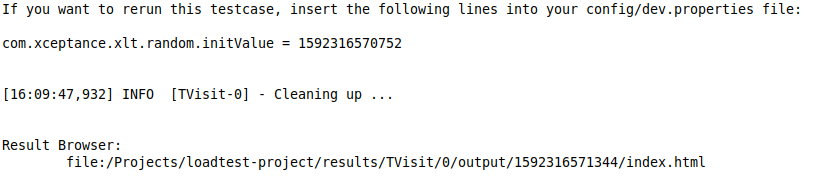
Console output for local test run
This is handy during test development, but these results (result browsers) will also be available (depending on your test settings, see above) in your load test setups. All saved results can be found in the <testsuite>/results directory. The subdirectory structure is as follows:
---+ results
   `---+ [testcase]
       `---+ [virtual-user]
           `---+ output
               `---+ [transaction-ID]
                   |---- css
                   |---- images
                   |---+ pages
                   |   `--- cache
                   `---- responses
The saved page output is held in a folder that represents a specific execution of a test (results/[testcase]/[virtual-user]/output/[transaction-ID]). There you will find an index.html containing the XLT Result Browser. The result browser comes with an integrated navigation side bar to facilitate browsing the complete page output of the transaction and looking at every single request in detail. The file last.html in the output folder results/[testcase]/[virtual-user]/output references the result browser for the last executed transaction of this virtual user.
The result browser navigation will only permit access to the pages of a transaction if they are directly related to actions. Therefore, defining actions correctly is very important to make the most effective use of the result browser. For details on how to structure test cases and create actions, see Basic Concepts and Code Structuring Recommendations.

XLT Result Browser - Page Output
Navigation, Color Coding and Filtering
The result browser contains two panels: the area on the left-hand side can be used to navigate the ‘steps’ - actions and requests - of your test case. The right side presents the output of your object under test (the site you are testing) or more detailed request information.
If you click on one of the actions in the navigation, the result browser will show the respective page. Please note: the output on the right-hand side may more or less resemble your webpage. Typically, in this view Javascript is disabled and only embedded CSS is applied, so the shown page will differ slightly from the original.
When you double-click an action (or click the little arrow left of it), the navigation will expand to list all related requests. The listed requests are color-coded as follows:
- Requests that return with status code 301 or 302 are redirects and will appear grey .
- Requests that return with status code 0, 400 or anything greater than 400 are errors and will appear red .
- All other requests will appear
black
unless the value of their content type meets one of the following conditions:
- If the content type contains the string
javascriptor is equal toapplication/json, the request will appear purple . - If the content type starts with the string
image, the request will appear green . - If the content type is
text/css, the request will appear blue .
- If the content type contains the string
Please note that the content type is determined by the appropriate HTTP response header value. Thus, if a JavaScript file is delivered as content type text/plain then this request will be color-coded black.

XLT Result Browser - Request Color Coding
A small menu at the top will give you the possibility of filtering your output for certain content types (you can look up the color coding there too), request methods and employed protocols. To enable or disable a certain filter, simply toggle its checkbox.

XLT Result Browser - Request Filters
Clicking on one of the requests will display its details.
Request and Response Information
When you select one of the requests from the navigation, the page content will be replaced by detailed information about the request and the related response. Four tabs at the top of the page will display the following information:
- Request/Response Information
- General Information
- Request and Response Headers
- URL Query and POST Parameters (if any)
- for POST requests: either the form data or (a part of) the raw request body
- for PUT and PATCH requests: (a part of) the raw request body
- Request Body (Raw)
- Response Content
- JSON

XLT Result Browser - Request Details
Response Content Tools
Use the tabs at the top of the right-hand side output area to see the (raw) request body and response content. If you opened the report as a file from a local disk, most browser will warn you that the content can not be displayed. This is caused by a security measure in place to prevent exposing local data. Please use a local webserver instead to open the report from a local disk. Recommended applications are Node.JS - serve, Python SimpleHTTPServer, or the PHP Built-In Web Server.

XLT Result Browser - Response Content
This can be a lot of data that might not be structured at all, so the result browser provides two handy tools to enhance readability:
- by clicking Beautify the indentations are corrected (or added, if there were none),

XLT Result Browser - Response Content, beautified
- and by clicking Highlight, syntax highlighting will be added to the code.

XLT Result Browser - Response Content, highlighted
Furthermore, there is a Select All button, which enables you to easily copy and paste the response content.
If the response is in JSON format, the result browser also features a tab where JSON responses are displayed in a tree-like view with expandable/collapsible sections that can also be searched and filtered.
Element Inspection
Since the right-hand side output of an action represents the state of its associated page, you can use the output to inspect the page elements and their state. Simply use the inspection tool of your browser (e.g. Chrome Developer Tools) or plugin to analyze the page and its elements.
As described earlier, the output of an action shows the state of the page after a user interaction (with all the associated requests) was executed. The page output of an action does not include <script> commands. These have been removed by XLT to avoid script execution while you are reviewing the output in your browser.

XLT Result Browser - Inspect Element
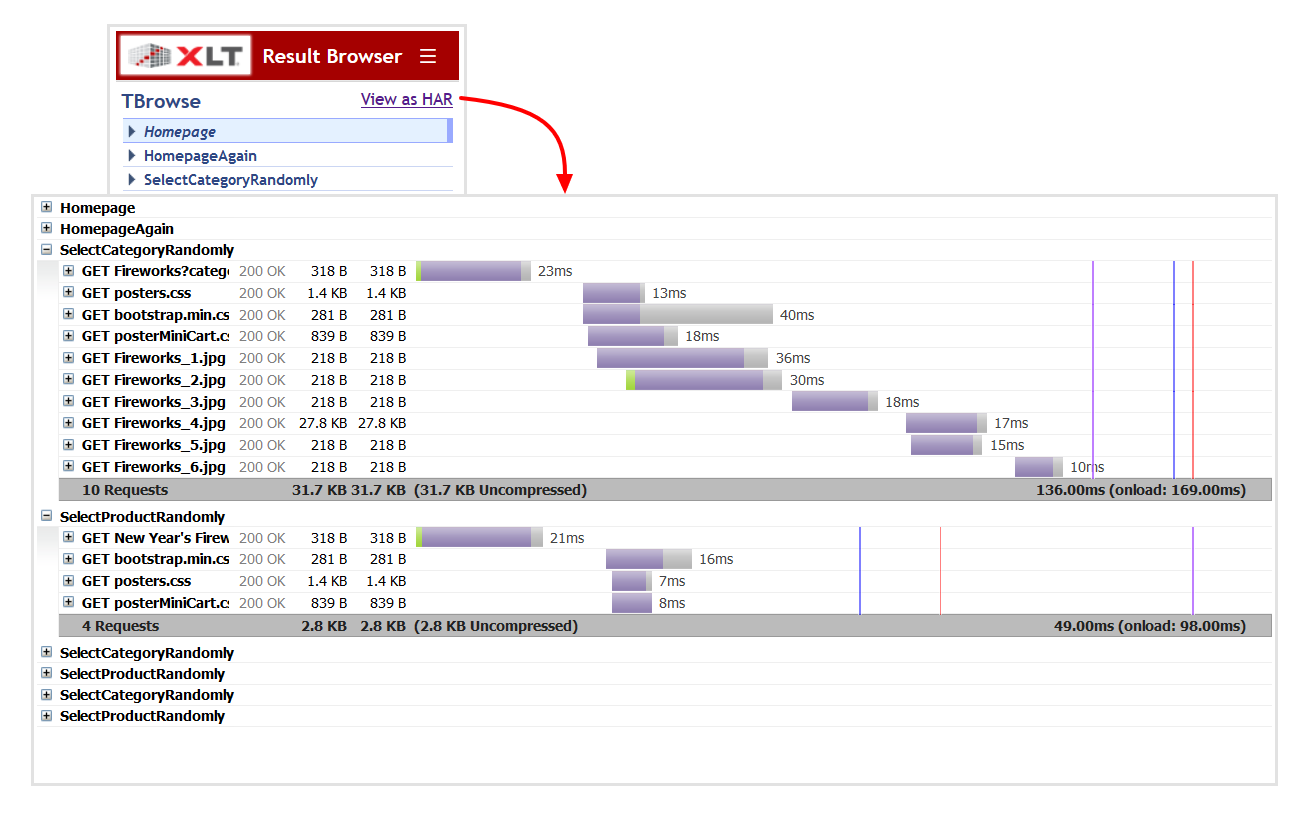
Request timeline
In order to let you inspect the temporal sequence and duration of requests in a graphical timeline view, XLT may generate an HTTP Archive (HAR) file along with an appropriate viewer as part of the result browser. The HAR file contains information about all requests/responses grouped by their corresponding action, including headers, sizes, and network timings. For client-performance tests, page load event timings are included as well. In order to save valuable disk space, the response content is NOT included in the generated HAR files.
To enable this feature, add the following line to your test configuration:
com.xceptance.xlt.output2disk.writeHarFile = true
The HAR viewer can be opened either by clicking the View as HAR link
in the result browser or directly by opening the harviewer.html file
in the root directory of the result browser.
HAR Viewer