Report Configuration
By adjusting the report options you can already adjust the focus of your generated reports very well, but there are even more possibilities by configuring the file <xlt>/config/reportgenerator.properties.
Using Custom Report Generator Settings
When analyzing the load test results, one often needs different views on
the data. For example, one can get a different view by changing the
request merge rules and regenerating the report. To simplify this
process, the load report generator has been enhanced to process an
optional properties file that is passed on the command line. This file
can contain customized settings that override those made in
<xlt>/config/reportgenerator.properties and
<testsuite>/config/project.properties. This
allows to predefine different configurations and use them as
necessary:
bin $ ./create_report.sh ../results/20191224-131200 -pf ../config/myPerfectReportGenerator.properties
Customizing the Default Output Directory
To define your preferred default directory where test reports shall be stored (which is used when no custom output directory is specified during report generation), set:
com.xceptance.xlt.reportgenerator.reports = myReports
Opening Result Browsers from the Load Test Report
If an error occurred during the load test, the error entry in the load test report may also contain the name of the corresponding result browser directory. These result browsers can be made directly accessible right from the load test report. This greatly speeds up error analysis as the result browsers are just one click away.
In order to let the report generator create links from the load report
to the result browsers, set the property
com.xceptance.xlt.reportgenerator.linkToResultBrowsers to true. By default, the
report generator calculates the path from the report to the result
browsers based on the results directory and the report directory. The
computed path will be a relative path if possible and an absolute path
otherwise (on Windows, if report and results are on different drives).
Sometimes the relative path approach is not suitable, for example if you
send the report to your team members, but not the results. In this case,
the results must be made available somewhere on the net. The report
generator needs to know about this location to properly generate the
links. To this end, you configure a results base URI, for example
http://myhost/results. The URI is a base URI as it is common for the
results of all of your load tests. The report generator automatically
appends the name of the results directory (for example
20121106-111751) to this URI when generating the links to the result
browsers, so the resulting link might look like this:
http://myhost/results/20121106-111751/ac01_00/TSearch/126/output/1352194484275/index.html
By using a base URI you do not need to reconfigure the report generator
when creating the report for another load test, unless you choose the
publish the results at a totally different location. To configure the
base URI, set the property
com.xceptance.xlt.reportgenerator.resultsBaseUri to the appropriate value.
In any case, make sure that the results are (or will be) published at the target location and will always stay there. Otherwise, the viewers of the report would experience broken links.
Defining the Percentiles

Percentiles
The percentiles shown in runtime data tables default to 50, 95, 99 and 99.9. However this can be customized:
## The percentiles to show in runtime data tables. Specify them as a comma-
## separated list of double values in the range (0, 100].
## Defaults to "50, 95, 99, 99.9". If left empty, no percentiles will be shown.
com.xceptance.xlt.reportgenerator.runtimePercentiles = 50, 95, 99, 99.9
In order to optimize the calculation of percentiles, percentile values have a precision of 10 milliseconds only. That’s why the shown percentile values may be (slightly) smaller than the actual value. That also explains why a percentile could sometimes even be smaller than the minimum value and P100 could be smaller than the maximum value.
Keep in mind that if you use too many datapoints, the tables get too wide and report evaluation gets harder.
Adjusting the Charting
XLT has extensive ways to adjust its generated charts to see more details. You can adjust the width and height of the charts if required (the size is given in pixels):
com.xceptance.xlt.reportgenerator.charts.width = 900
com.xceptance.xlt.reportgenerator.charts.height = 300
Scale
You can also adjust the scale used for the y-axis in the run time charts. Valid values are “linear” (which is the default) and “logarithmic”. This, for example, is how you can still see the runtime differences in your “normal” requests when there are some timeouts that would otherwise completely mess up your scale and make everything below a minute indistinguishable noise.
com.xceptance.xlt.reportgenerator.charts.scale = logarithmic
Capping
Another way to make your charts show meaningful data is to adjust the capping, i.e. the run time value above which the chart is just cropped. The cap can be defined using two alternative methods. First, you may specify the capping value directly. Second, you may specify a factor that, when applied to the mean of all run time values, defines the ultimate capping value (e.g. mean runtime is 500ms, then for a cappingFactor of 5 the charts are capped at 2500ms). This factor must be a double greater than 1. Note that capping values take precedence over capping factors. By default, there is no capping.
Furthermore, you may configure the capping mode (com.xceptance.xlt.reportgenerator.charts.cappingMode):
- smart: cap the chart only if necessary (i. e. max > cap - this is the default)
- always: always cap the chart at the capping value
Note that the capping value/factor and the capping mode can be defined separately for each chart type, but it is also possible to define a default that applies to all chart types:
# Default:
com.xceptance.xlt.reportgenerator.charts.cappingValue = 5000
# Transaction Charts
com.xceptance.xlt.reportgenerator.charts.cappingValue.transactions = 50000
# Action Charts
com.xceptance.xlt.reportgenerator.charts.cappingValue.actions = 10000
# Request Charts
com.xceptance.xlt.reportgenerator.charts.cappingValue.requests = 5000
# Custom Timers Charts
com.xceptance.xlt.reportgenerator.charts.cappingValue.custom = 15
For example, to cap transaction charts to a value of 10000 (10sec), all other chart types (default) to a value of 5000 (5sec), always, use:
com.xceptance.xlt.reportgenerator.charts.cappingValue = 5000
com.xceptance.xlt.reportgenerator.charts.cappingValue.transactions = 10000
com.xceptance.xlt.reportgenerator.charts.cappingMode = always
To cap request charts to a factor of 5 of request mean time, all other chart types (default) to a factor of 10, in smart mode (which is default), use:
com.xceptance.xlt.reportgenerator.charts.cappingFactor = 10
com.xceptance.xlt.reportgenerator.charts.cappingFactor.requests = 5
Example
Here is a small glimpse of what can be done by this feature - first, we have the default chart without any customized capping:
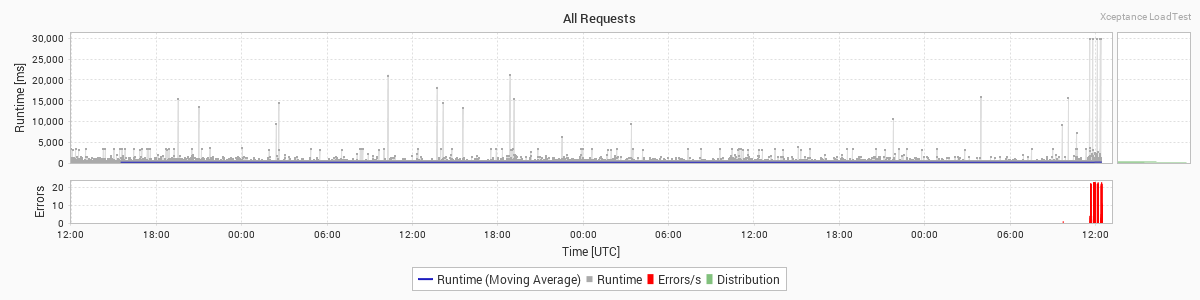
All requests, without capping.
As you can see, very few of the requests have runtimes up to 30.000 ms, but most seem to be well below 5.000 ms. So let’s try to just cap it all at 5 seconds:
com.xceptance.xlt.reportgenerator.charts.cappingValue = 5000

All requests, capped at 5.000 ms.
Now some of the requests still take about 3.000 ms, but most are still a grey something at the bottom of the chart - it’s hard to spot interesting details in the lower part of the chart, that still contains most requests. So this time, let’s just cap the chart at five times the request meantime, which is about 200 ms:
com.xceptance.xlt.reportgenerator.charts.cappingFactor = 5
All requests, capped at 5x request meantime.
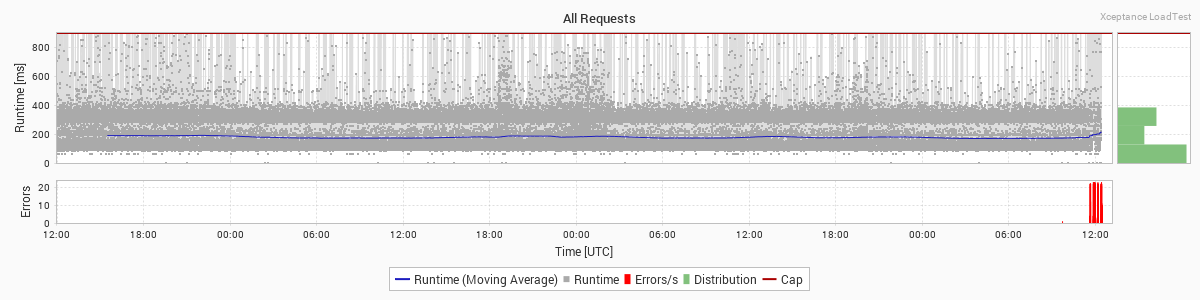
This enables us to notice the patterns in the bottom, but of course all information for requests taking more than 1 second is lost now. A middle ground can be found by using a logarithmic scale for the chart’s y axis instead of capping - this way, you can focus more on the shorter running requests, while still having the information for the longer running requests at hand.
com.xceptance.xlt.reportgenerator.charts.scale = logarithmic

All requests, with logarithmic y axis.
This is just a glimpse of what is possible, and often there is no one right way to go about things, but several different versions compared side-by-side might provide the information you need.
Apdex Definition
The load test report lists the Apdex for each action.
Apdex (Application Performance Index) is an open standard developed by an alliance of companies. It defines a standard method for reporting and comparing the performance of software applications in computing. Its purpose is to convert measurements into insights about user satisfaction, by specifying a uniform way to analyze and report on the degree to which measured performance meets user expectations. - Wikipedia
In short, the Apdex calculation for an action is based on a single threshold value that denotes the boundary between satisfying and (more or less) unsatisfying action runtimes. From the number of actions that are either satisfying or unsatisfying, a metric is derived that expresses the achieved user satisfaction as a normalized value in the range [0.0, 1.0]. The Apdex specification also defines a rating of the achieved value, ranging from ‘Excellent’ to ‘Unacceptable’. Since Apdex values are normalized, they can be compared and sorted easily even if their underlying threshold is different. For more information see the Apdex specification.
See below for an example that shows the achieved Apdex for different actions for which thresholds of 1.0, 2.0, or 3.0 seconds were defined. When sorting by the Apdex (or just looking at the colored table cells), problematic actions can be identified easily:

Apdex for actions
The Apdex threshold is configurable per action, but you can also group actions by name (via regular expressions) for less configuration effort. Apdex thresholds can be defined either globally in <xlt>/config/reportgenerator.properties or in your test suite settings, e.g. in <test-suite>/config/project.properties. See below for an example:
## The threshold for all checkout-related actions.
com.xceptance.xlt.reportgenerator.apdex.Checkout.actions = CO(Login|Billing|Shipping).*
com.xceptance.xlt.reportgenerator.apdex.Checkout.threshold = 2.0

## The threshold for order placement.
com.xceptance.xlt.reportgenerator.apdex.PlaceOrder.actions = COPlaceOrder
com.xceptance.xlt.reportgenerator.apdex.PlaceOrder.threshold = 3.0

## The threshold for all other actions.
com.xceptance.xlt.reportgenerator.apdex.default.threshold = 1.0
Report Colorization
The amount of data shown in the data tables can sometimes be overwhelming and hard to evaluate. This is especially true for the Requests table. However, if you have already defined some acceptance criteria for certain types of requests (or you always wanted to do so), then XLT can help focus on requests that violate these criteria by coloring the respective table cells. This way it is much easier to spot problematic requests when skimming through the table.

Table cell coloring for requests
In contrast to the Apdex for actions, where you get an extra value, you are free to define the coloring for most of the already existing table columns. Currently, this includes mean, minimum, maximum, percentiles, and runtime segmentation values.
Table cells are colored based on a certain target value and a lower and upper boundary. If the actual value exceeds the target, the cell will gradually turn more red, and if it goes below the target, the report will reward you with a greenish background. When the value reaches the lower/upper limit, the background color will stay either bright green or red.
The target value and upper and lower boundaries are configurable per request, but, same as for the Apdex, you can also group requests by name (via regular expressions) for less configuration effort and there is also a default rule for all other requests. See below for a sample configuration:
## Use specific colorization rules for COLogin/COBilling/COShipping requests
com.xceptance.xlt.reportgenerator.requests.table.colorization.Checkout.matching = CO(Login|Billing|Shipping).*
com.xceptance.xlt.reportgenerator.requests.table.colorization.Checkout.mean = 250 500 1000
com.xceptance.xlt.reportgenerator.requests.table.colorization.Checkout.percentile.p95.id = 95
com.xceptance.xlt.reportgenerator.requests.table.colorization.Checkout.percentile.p95 = 375 750 1500

## Use specific colorization rules for COPlaceOrder requests
com.xceptance.xlt.reportgenerator.requests.table.colorization.PlaceOrder.matching = COPlaceOrder.*
com.xceptance.xlt.reportgenerator.requests.table.colorization.PlaceOrder.mean = 1000 2000 4000
com.xceptance.xlt.reportgenerator.requests.table.colorization.PlaceOrder.percentile.p95.id = 95
com.xceptance.xlt.reportgenerator.requests.table.colorization.PlaceOrder.percentile.p95 = 1500 3000 6000

## Overwrite colorization rules for the default group.
com.xceptance.xlt.reportgenerator.requests.table.colorization.default.mean = 125 250 500
com.xceptance.xlt.reportgenerator.requests.table.colorization.default.percentile.p95.id = 95
com.xceptance.xlt.reportgenerator.requests.table.colorization.default.percentile.p95 = 250 500 1000
Again, you can configure this either in <xlt>/config/reportgenerator.properties or, alternatively, in your test suite settings, e.g. in <test-suite>/config/project.properties. You might even want to create additional property files for your favorite report colorization and then include them in your project properties as needed.
If you don’t want to highlight requests that exceed/fall below the target value, simply set the respective boundary equal to the target value. Typically, you would do this for requests outperforming the target value, so you can focus on the red ones.
Merge Rules
In order to reduce the list of requests in the report, the values of different requests can be merged together. This is done by defining merge rules for your project. Merge rules are one of the most unique XLT features, you can also think of them as bucketing rules for your requests. Setting them up requires some careful thinking, as they can do quite some harm to your reports, but well crafted merge rules will help you make sense of your reports. You can read more on this topic in the Advanced section.
Masking Passwords in the Test Report
In case you need to share load test reports with others, you may not
want to expose passwords and other sensitive information, but they
appear in clear text in the configuration section of the report. That’s
why the report generator can be configured to mask the values of
certain properties, i.e. their values will be replaced with ******. Specify
the properties to be masked using a regular expression in
<xlt>/config/reportgenerator.properties, for example:
com.xceptance.xlt.reportgenerator.maskPropertiesRegex = (?i)(password|passphrase|login)
By default, any property with the substring password in the name will be masked.
Limiting Error Charts
When analyzing and communicating the results of a load test, the Errors section is always of special interest. It does not only list the different types of errors, but also generates a chart for each type of error.

Request Errors
Transaction Error Details
The report generator can create different error charts:
- Request error charts - A separate chart for each encountered HTTP server error status code (>= 500) and another one for code 0, i.e. there was no response at all.
- Transaction error overview charts - A separate chart per transaction error type, over all transactions.
- Transaction error detail charts - A separate chart per transaction error type, grouped by transaction/action name.
Note that the error message text defines the “type of error”. All errors with the same message are grouped together. If you have dynamic parts in your error messages, e.g. a SKU, you may end up with thousands of different error types. Consequently, the report generator would have to create as many charts. To avoid this situation, the report generator will generate charts for the topmost 50 errors only by default.
However, you can tailor this limit selectively in
reportgenerator.properties. See the following example:
com.xceptance.xlt.reportgenerator.errors.requestErrorOverviewChartsLimit = 0
com.xceptance.xlt.reportgenerator.errors.transactionErrorOverviewChartsLimit = –1
com.xceptance.xlt.reportgenerator.errors.transactionErrorDetailChartsLimit = 10
With these settings the report generator will create as many transaction error overview charts as needed, but only 10 transaction error detail charts and no request error charts at all.
Turning off Event Grouping by Test Case
Events shown in the Event Details table are usually grouped by test case. In cases where you don’t need this grouping, you can turn it off via configuration in
<xlt>/config/reportgenerator.properties or, alternatively, in your test suite settings, e.g. in <test-suite>/config/project.properties:
com.xceptance.xlt.reportgenerator.events.groupByTestCase = false
Faster Report Creation on Multi-CPU Machines
The load test report generator makes use of all available CPUs when generating charts, when reading, parsing and pre-processing data records, and while generating the HTML report pages. This way, especially result sets with many or very sophisticated request merge rules are processed much faster.
In case you want to limit the number of CPUs used during report
generation, set the property com.xceptance.xlt.reportgenerator.threads to an appropriate value.